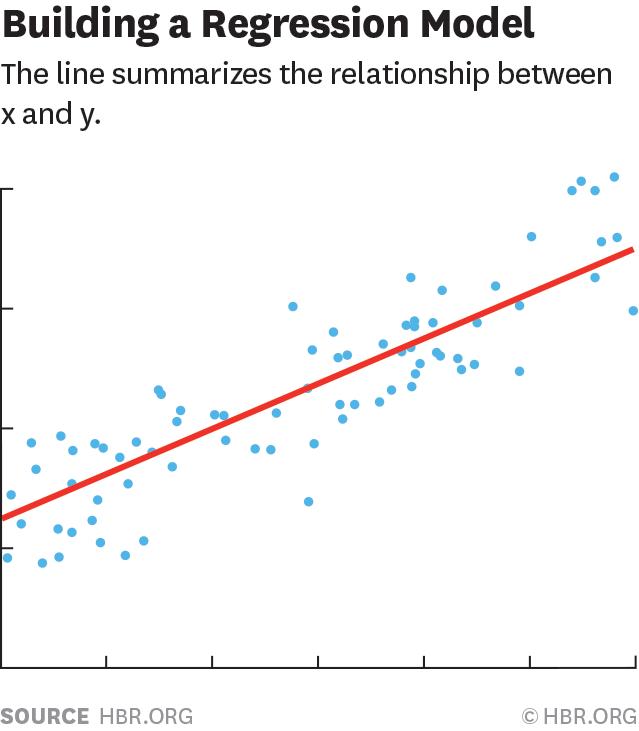
Inbigdataanalysis,regressionanalysisisapredictivemodelingtechniquethatstudiestherelationshipbetweenthedependentvariable(target)andtheindependentvariable(predictor).Thistechniqueiscommonlyusedforpredictiveanalysis,timeseriesmodeling,anddiscoveryofcausalrelationshipsbetweenvariables.Forexample,thebestwaytostudytherelationshipbetweendriver'srecklessdrivingandthenumberofroadtrafficaccidentsisregression.
Methods
Therearevariousregressiontechniquesforprediction.Thesetechniquesmainlyhavethreemeasures(thenumberofindependentvariables,thetypeofdependentvariable,andtheshapeoftheregressionline).
1.LinearRegression
Itisoneofthemostwell-knownmodelingtechniques.Linearregressionisusuallyoneofthepreferredtechniqueswhenpeoplelearnpredictivemodels.Inthistechnique,thedependentvariableiscontinuous,theindependentvariablecanbecontinuousordiscrete,andthenatureoftheregressionlineislinear.
Linearregressionusesthebestfittedstraightline(alsoknownastheregressionline)toestablisharelationshipbetweenthedependentvariable(Y)andoneormoreindependentvariables(X).
MultiplelinearregressioncanbeexpressedasY=a+b1*X+b2*X2+e,wherearepresentstheintercept,brepresentstheslopeofthestraightline,andeistheerrorterm.Multiplelinearregressioncanpredictthevalueofthetargetvariablebasedonagivenpredictorvariable(s).
2.LogisticRegressionLogisticRegression
Logisticregressionisusedtocalculatetheprobabilityof"event=Success"and"event=Failure".Whenthetypeofthedependentvariableisabinary(1/0,true/false,yes/no)variable,logisticregressionshouldbeused.Here,thevalueofYis0or1,anditcanbeexpressedbythefollowingequation.
odds=p/(1-p)=probabilityofeventoccurrence/probabilityofnoteventoccurrence
ln(odds)=ln(p/(1-p))
logit(p)=ln(p/(1-p))=b0+b1X1+b2X2+b3X3....+bkXk
Intheaboveformula,theexpressionphasTheprobabilityofacertainfeature.Youshouldaskthequestion:"Whyuselogarithmintheformula?".
Becausethebinomialdistribution(dependentvariable)isusedhere,itisnecessarytochoosealinkfunctionthatisbestforthisdistribution.ItistheLogitfunction.Intheaboveequation,theparametersareselectedbyobservingthemaximumlikelihoodestimatesofthesample,ratherthanminimizingthesumofsquareerror(asusedinordinaryregression).
3.PolynomialRegression
Foraregressionequation,iftheindexoftheindependentvariableisgreaterthan1,thenitisapolynomialregressionequation.Asshowninthefollowingequation:
y=a+b*x^2
Inthisregressiontechnique,thebestfitlineisnotastraightline.Itisacurveusedtofitthedatapoints.
4.StepwiseRegression
Thisformofregressioncanbeusedwhendealingwithmultipleindependentvariables.Inthistechnique,theselectionofindependentvariablesisdoneinanautomaticprocess,includingnon-humanoperations.
Thisfeatistoidentifyimportantvariablesbyobservingstatisticalvalues,suchasR-square,t-statsandAICindicators.Stepwiseregressionfitsthemodelbyadding/removingcovariatesbasedonspecifiedcriteriaatthesametime.Someofthemostcommonlyusedstepwiseregressionmethodsarelistedbelow:
Thestandardstepwiseregressionmethoddoestwothings.Thatis,thepredictionrequiredforeachstepisaddedanddeleted.
Theforwardselectionmethodstartswiththemostsignificantpredictioninthemodel,andthenaddsvariablesforeachstep.
Thebackwardeliminationmethodstartsatthesametimeasallpredictionsofthemodel,andtheneliminatestheleastsignificantvariableateachstep.
Thepurposeofthismodelingtechniqueistousetheleastnumberofpredictorstomaximizepredictivepower.Thisisalsooneofthewaystodealwithhigh-dimensionaldatasets.2
5.RidgeRegression
Whenthereismultiplecollinearity(independentvariablesarehighlycorrelated)betweenthedata,ridgeregressionanalysisisrequired.Inthepresenceofmulticollinearity,althoughtheestimatedvaluemeasuredbytheleastsquaremethod(OLS)doesnothaveabias,theirvariancewillbelarge,whichmakestheobservedvalueveryfarfromthetruevalue.Ridgeregressionreducesthestandarderrorbyaddingadeviationvaluetotheregressionestimate.
Inthelinearequation,thepredictionerrorcanbedividedinto2components,oneiscausedbybiasandtheotheriscausedbyvariance.Thepredictionerrormaybecausedbyeitherorbothofthese.Here,theerrorcausedbyvariancewillbediscussed.
Ridgeregressionsolvestheproblemofmulticollinearitythroughtheshrinkageparameterλ(lambda).Considerthefollowingequation:
L2=argmin||y=xβ||
+λ||β||
Inthisformula,Therearetwocomponents.Thefirstistheleastsquareterm,andtheotherisλtimesβ-square,whereβisthecorrelationcoefficientvector,whichisaddedtotheleastsquaretermtogetherwiththeshrinkageparametertogetaverylowvariance.
6.LassoRegression
Itissimilartoridgeregression.Lasso(LeastAbsoluteShrinkageandSelectionOperator)willalsogiveapenaltyvaluetotheregressioncoefficientvector.Inaddition,itcanreducethedegreeofvariationandimprovetheaccuracyofthelinearregressionmodel.Takealookatthefollowingformula:
L1=agrmin||y-xβ||
+λ||β||
LassoregressionandRidgeregressionhaveOnedifferenceisthatthepenaltyfunctionitusesistheL1norm,nottheL2norm.Thisleadstoapenalty(orequaltothesumoftheabsolutevalueoftheconstraintestimate)valuethatmakessomeparameterestimatesequaltozero.Thelargerthepenaltyvalueis,thefurtherestimationwillmakethereductionvalueclosertozero.Thiswillresultintheselectionofvariablesfromthegivennvariables.
Ifthepredictedsetofvariablesishighlycorrelated,Lassowillselectoneofthevariablesandshrinktheotherstozero.
7.ElasticNetregression
ElasticNetisamixtureofLassoandRidgeregressiontechniques.ItusesL1fortrainingandL2firstastheregularizationmatrix.ElasticNetisusefulwhentherearemultiplerelatedfeatures.Lassowillpickoneofthematrandom,whileElasticNetwillchoosetwo.
ThepracticaladvantagebetweenLassoandRidgeisthatitallowsElasticNettoinheritsomeofthestabilityofRidgeintheloopstate.
Dataexplorationisaninevitablepartofbuildingapredictivemodel.Itshouldbethefirststepwhenchoosingasuitablemodel,suchasidentifyingtherelationshipandinfluenceofvariables.Moresuitablefortheadvantagesofdifferentmodels,youcananalyzedifferentindexparameters,suchasstatisticallysignificantparameters,R-square,AdjustedR-square,AIC,BIC,anderrorterms.TheotheristheMallows’Cpcriterion.Thisismainlybycomparingthemodelwithallpossiblesub-models(orchoosingthemcarefully)andcheckingforpossibledeviationsinyourmodel.
Crossvalidationisthebestwaytoevaluatepredictivemodels.Here,divideyourdatasetintotwo(onefortrainingandoneforvalidation).Useasimplemeansquareerrorbetweentheobservedvalueandthepredictedvaluetomeasureyourpredictionaccuracy.
Ifyourdatasetismultiplemixedvariables,thenyoushouldnotchoosetheautomaticmodelselectionmethod,becauseyoushouldnotwanttoputallthevariablesinthesamemodelatthesametime.
Itwillalsodependonyourpurpose.Itmayhappenthatalesspowerfulmodeliseasiertoimplementthanahighlystatisticallysignificantmodel.Regressionregularizationmethods(Lasso,RidgeandElasticNet)workwellinthecaseofhigh-dimensionalandmulticollinearitybetweendatasetvariables.3
Assumptionsandcontent
Indataanalysis,someconditionalassumptionsaregenerallyrequiredforthedata:
Homogeneityofvariance
LinearityRelations
Accumulationofeffects
Variableshavenomeasurementerror
Variablesfollowamultivariatenormaldistribution
Observeindependence
Themodeliscomplete(novariablesthatshouldnotbeentered,andnovariablesthatshouldbeenteredarenotincluded)
Theerrortermisindependentandobeys(0,1)normaldistribution.
Realisticdataoftencannotfullycomplywiththeaboveassumptions.Therefore,statisticianshavedevelopedmanyregressionmodelstosolvetheconstraintsoftheassumedprocessoflinearregressionmodels.
Themaincontentofregressionanalysisis:
①Startingfromasetofdata,determinethequantitativerelationshipbetweencertainvariables,thatis,establishamathematicalmodelandestimatetheunknownparameters.Thecommonmethodofestimatingparametersistheleastsquaresmethod.
②Testthecredibilityoftheserelations.
③Intherelationshipwheremanyindependentvariablesaffectadependentvariabletogether,determinewhich(orwhich)independentvariableshavesignificanteffects,andwhichindependentvariableshaveinsignificanteffects,willaffectsignificantTheindependentvariablesareaddedtothemodel,andtheinsignificantvariablesareeliminated,usuallybystepwiseregression,forwardregression,andbackwardregression.
④Usetherequiredrelationshiptopredictorcontrolacertainproductionprocess.Theapplicationofregressionanalysisisveryextensive,andthestatisticalsoftwarepackagemakesthecalculationofvariousregressionmethodsveryconvenient.
Inregressionanalysis,variablesaredividedintotwocategories.Onetypeisdependentvariables,whichareusuallyatypeofindexthatisconcernedinactualproblems,usuallyrepresentedbyY;andtheothertypeofvariablethataffectsthevalueofthedependentvariableiscalledindependentvariable,whichisrepresentedbyX.
Themainproblemsofregressionanalysisresearchare:
(1)DeterminethequantitativerelationshipexpressionbetweenYandX,thisexpressioniscalledregressionequation;
(2)Testthereliabilityoftheobtainedregressionequation;
(3)DeterminewhethertheindependentvariableXhasaneffectonthedependentvariableY;
(4)Usetheobtainedregressionequationtopredictandcontrol.4
Application
Correlationanalysisstudiesthecorrelationbetweenphenomena,thedirectionandclosenessofcorrelation,andgenerallydoesnotdistinguishbetweenindependentvariablesordependentvariables.Regressionanalysisistoanalyzethespecificformsofcorrelationbetweenphenomena,determinethecausalrelationship,andusemathematicalmodelstoexpressthespecificrelationship.Forexample,itcanbeknownfromcorrelationanalysisthat"quality"and"usersatisfaction"variablesarecloselyrelated,butwhichvariablebetweenthesetwovariablesisaffectedbywhichvariable,andthedegreeofinfluence,requiresregressionanalysis.tomakesure.1
Generallyspeaking,regressionanalysisistodeterminethecausalrelationshipbetweendependentvariablesandindependentvariables,establisharegressionmodel,andsolvetheparametersofthemodelbasedonthemeasureddata,andthenevaluatetheregressionmodelWhetheritcanfitthemeasureddatawell;ifitcanfitwell,youcanmakefurtherpredictionsbasedontheindependentvariables.
Forexample,ifyouwanttostudythecausalrelationshipbetweenqualityandusersatisfaction,inapracticalsense,productqualitywillaffectusersatisfaction,sosetusersatisfactionasthedependentvariableandrecorditasY;Qualityistheindependentvariable,denotedasX.Thefollowinglinearrelationshipcanusuallybeestablished:Y=A+BX+§
where:AandBareundeterminedparameters,Aistheinterceptoftheregressionline;Bistheslopeoftheregressionline,whichmeansthatXchangesbyoneInunit,theaveragechangeofY;§isarandomerroritemthatdependsonusersatisfaction.
Fortheempiricalregressionequation:y=0.857+0.836x
Theinterceptoftheregressionlineonthey-axisis0.857andtheslopeis0.836,whichmeansthatforeverypointinquality,usersatisfactionAnaverageincreaseof0.836points;inotherwords,thecontributionofa1pointimprovementinqualitytousersatisfactionis0.836points.
Theexampleshownaboveisasimplelinearregressionproblemofoneindependentvariable.Duringdataanalysis,thiscanalsobeextendedtomultipleregressionofmultipleindependentvariables.PleaserefertothespecificregressionprocessandmeaningRefertorelevantstatisticsbooks.Inaddition,intheSPSSresultoutput,R2,FtestvalueandTtestvaluecanalsobereported.R2isalsocalledthecoefficientofdeterminationoftheequation,whichindicatesthedegreeofinterpretationofthevariableXtoYintheequation.ThevalueofR2isbetween0and1.Thecloserto1,thestrongertheinterpretationabilityofXtoYintheequation.R2isusuallymultipliedby100%toexpressthepercentageofYchangeexplainedbytheregressionequation.TheFtestisoutputthroughtheanalysisofvariancetable,andthesignificancelevelisusedtotestwhetherthelinearrelationshipoftheregressionequationissignificant.Generallyspeaking,significancelevelsabove0.05aremeaningful.WhentheFtestpasses,itmeansthatatleastoneoftheregressioncoefficientsintheequationissignificant,butnotallregressioncoefficientsaresignificant,soaTtestisneededtoverifythesignificanceoftheregressioncoefficients.Similarly,theTtestcanbedeterminedbythesignificanceleveloralook-uptable.Intheexampleshownabove,themeaningofeachparameterisshowninthetablebelow.
Linearregressionequationtest

index | value | Significancelevel | Significance |
R2 | 0.89 | "Quality"explains89%ofthedegreeofchangein"UserSatisfaction" | |
F | 276.82 | 0.001 | Thelinearrelationshipoftheregressionequationissignificant |
T | 16.64 | 0.001 | Thecoefficientoftheregressionequationissignificant |
SamplelinearregressionanalysisofSIMmobilephoneusersatisfactionandrelatedvariables
TakethelinearregressionanalysisofSIMmobilephoneusersatisfactionandrelatedvariablesasanexampletofurtherillustrateApplicationoflinearregression.Inapracticalsense,mobilephoneusersatisfactionshouldberelatedtoproductquality,price,andimage.Therefore,“usersatisfaction”isusedasthedependentvariable,and“quality”,“image”and“price”areindependentvariables.regressionanalysis.UsingtheregressionanalysisofSPSSsoftware,theregressionequationisobtainedasfollows:
Usersatisfaction=0.008×image+0.645×quality+0.221×price
ForSIMmobilephones,thequalityisThecontributionofusersatisfactionisrelativelylarge.Forevery1pointincreaseinquality,usersatisfactionwillincreaseby0.645points;followedbyprice.Forevery1pointincreaseintheevaluationofpricesbyusers,theirsatisfactionwillincreaseby0.221points;andtheimageissatisfiedwiththeproductusers.Thecontributionofdegreeisrelativelysmall,andforevery1pointincreaseinimage,usersatisfactiononlyincreasesby0.008points.
Thetestindicatorsandtheirmeaningsoftheequationareasfollows:
Index | Significancelevel | meaning | |
R2 | 0.89 | 89%ofusersatisfaction"thedegreeofchange | |
F | 248.53 | 0.001 | Thelinearrelationshipoftheregressionequationissignificant |
T(image) | 0.00 | 1.000 | The"image"variablehardlycontributestotheregressionequation |
T(quality) | 13.93 | 0.001 | "Quality"hasagreatcontributiontotheregressionequation |
T(price) | 5.00 | 0.001 | "Price"hasagreatcontributiontotheregressionequation | p>
Fromthepointofviewofthetestindicatorsoftheequation,"image"doesnotmakemuchcontributiontotheentireregressionequationandshouldbedeleted.Sothe"usersatisfaction"and"usersatisfaction"shouldbedeleted.Theregressionequationsof"quality"and"price"areasfollows:satisfaction=0.645×quality+0.221×price
Everytimeauser’sevaluationofthepriceincreasesby1point,hissatisfactionwillincreaseby0.221points(inthisexampleIn,“image”hasalmostnocontributiontotheequation,sotheequationobtainedissimilartothecoefficientsofthepreviousregressionequation).
Thetestindicatorsandmeaningsoftheequationareasfollows:
Index | Significancelevel | Significance | |
R2 | 0.89 | 89%Thedegreeofchangein"usersatisfaction" | |
F | 374.69 | 0.001 | Thelinearrelationshipoftheregressionequationissignificant |
T(quality) | 15.15 | 0.001 | "Quality"hasagreatcontributiontotheregressionequation |
T(price) | 5.06 | 0.001 | "Price"hasagreatcontributiontotheregressionequation |
Stepstodeterminevariables
Clarifythespecifictargetoftheprediction,andalsodeterminethedependentvariable.Ifthespecifictargetforforecastingisthesalesvolumeofthenextyear,thenthesalesvolumeYisthedependentvariable.Throughmarketresearchanddatareview,findtherelevantinfluencingfactorsoftheforecasttarget,thatis,independentvariables,andselectthemaininfluencingfactorsfromthem.
Establishingapredictivemodel
Calculatebasedonhistoricalstatisticaldataofindependentvariablesanddependentvariables,andestablishregressionanalysisequations,thatis,regressionanalysispredictivemodels.
Performingcorrelationanalysis
Regressionanalysisisthemathematicalstatisticalanalysisandprocessingofcausalinfluencingfactors(independentvariables)andpredictionobjects(dependentvariables).Onlywhentheindependentvariableandthedependentvariabledohaveacertainrelationship,theestablishedregressionequationismeaningful.Therefore,whetherthefactorastheindependentvariableisrelatedtothepredictedobjectasthedependentvariable,thedegreeofcorrelation,andthedegreeofcertaintyinjudgingthedegreeofsuchcorrelation,havebecomeproblemsthatmustbesolvedinregressionanalysis.Forcorrelationanalysis,correlationisgenerallyrequired,andthedegreeofcorrelationbetweentheindependentvariableandthedependentvariableisjudgedbythesizeofthecorrelationcoefficient.
Calculatethepredictionerror
Whethertheregressionpredictionmodelcanbeusedforactualpredictiondependsonthetestoftheregressionpredictionmodelandthecalculationofthepredictionerror.Onlywhentheregressionequationpassesvarioustestsandthepredictionerrorissmall,cantheregressionequationbeusedasapredictionmodelforprediction.
Determinethepredictedvalue
Usingtheregressionpredictionmodeltocalculatethepredictedvalue,andcomprehensivelyanalyzethepredictedvaluetodeterminethefinalpredictedvalue.
Payattentiontotheproblem
Whenapplyingtheregressionpredictionmethod,firstdeterminewhetherthereisacorrelationbetweenthevariables.Ifthereisnocorrelationbetweenthevariables,applyingregressionforecastingmethodstothesevariableswillgivewrongresults.
Payattentiontothecorrectapplicationofregressionanalysisandprediction:
①Usequalitativeanalysistodeterminethedependencebetweenphenomena;
②Avoidarbitraryextrapolationofregressionprediction;
③Applyappropriatedata;
