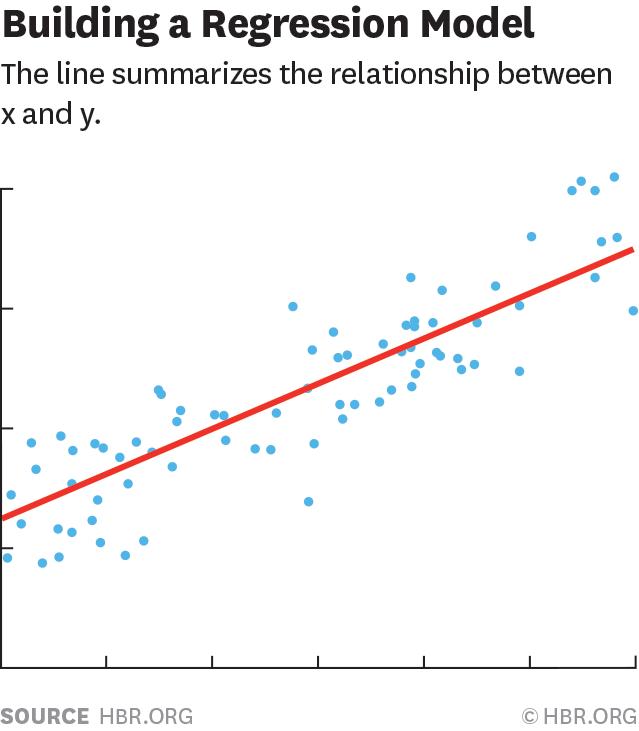
Inbigdataanalysis,regressionanalysisisapredictivemodelingtechniquethatstudiestherelationshipbetweenthedependentvariable(target)andtheindependentvariable(predictor).Thistechniqueiscommonlyusedforpredictiveanalysis,timeseriesmodeling,anddiscoveryofcausalrelationshipsbetweenvariables.Forexample,thebestwaytostudytherelationshipbetweendriver'srecklessdrivingandthenumberofroadtrafficaccidentsisregression.
Методи
Therearevariousregressiontechniquesforprediction.Thesetechniquesmainlyhavethreemeasures(thenumberofindependentvariables,thetypeofdependentvariable,andtheshapeoftheregressionline).
1.Линейна регресия
Itisoneofthemostwell-knownmodelingtechniques.Linearregressionisusuallyoneofthepreferredtechniqueswhenpeoplelearnpredictivemodels.Inthistechnique,thedependentvariableiscontinuous,theindependentvariablecanbecontinuousordiscrete,andthenatureoftheregressionlineislinear.
Linearregressionusesthebestfittedstraightline(alsoknownastheregressionline)toestablisharelationshipbetweenthedependentvariable(Y)andoneormoreindependentvariables(X).
Многолинейната регресия може да бъде изразена като Y=a+b1*X+b2*X2+e, където представлява пресечната точка, b представлява наклона на правата линия и е членът на грешката. Многолинейната регресия може да предвиди стойността на целевата променлива въз основа на дадена променлива(и) за прогнозиране.
2.Логистична регресияЛогистична регресия
Логистичната регресия се използва за изчисляване на вероятността за "събитие=успех" и "събитие=неуспех". Когато типът на зависимата променлива е двоична (1/0, вярно/невярно, да/не) променлива, трябва да се използват логистични регресии. Тук стойността на Y е 0 или 1 и може да бъде изразена чрез следното уравнение.
коефициенти=p/(1-p)=вероятност за събитие/вероятност за отбелязване на събитие
ln(коефициенти)=ln(p/(1-p))
logit(p)=ln(p/(1-p))=b0+b1X1+b2X2+b3X3....+bkXk
В горната формула изразът е Вероятността за лице на определена характеристика. Трябва да зададете въпроса: „Защо да използвате логаритъм във формулата?“.
Becausethebinomialdistribution(dependentvariable)isusedhere,itisnecessarytochoosealinkfunctionthatisbestforthisdistribution.ItistheLogitfunction.Intheaboveequation,theparametersareselectedbyobservingthemaximumlikelihoodestimatesofthesample,ratherthanminimizingthesumofsquareerror(asusedinordinaryregression).
3.Полиномна регресия
Foraregressionequation,iftheindexoftheindependentvariableisgreaterthan1,thenitisapolynomialregressionequation.Asshowninthefollowingequation:
y=a+b*x^2
Inthisregressiontechnique,thebestfitlineisnotastraightline.Itisacurveusedtofitthedatapoints.
4.Постъпкова регресия
Thisformofregressioncanbeusedwhendealingwithmultipleindependentvariables.Inthistechnique,theselectionofindependentvariablesisdoneinanautomaticprocess,includingnon-humanoperations.
Thisfeatistoidentifyimportantvariablesbyobservingstatisticalvalues,suchasR-square,t-statsandAICindicators.Stepwiseregressionfitsthemodelbyadding/removingcovariatesbasedonspecifiedcriteriaatthesametime.Someofthemostcommonlyusedstepwiseregressionmethodsarelistedbelow:
Thestandardstepwiseregressionmethoddoestwothings.Thatis,thepredictionrequiredforeachstepisaddedanddeleted.
Theforwardselectionmethodstartswiththemostsignificantpredictioninthemodel,andthenaddsvariablesforeachstep.
Thebackwardeliminationmethodstartsatthesametimeasallpredictionsofthemodel,andtheneliminatestheleastsignificantvariableateachstep.
Thepurposeofthismodelingtechniqueistousetheleastnumberofpredictorstomaximizepredictivepower.Thisisalsooneofthewaystodealwithhigh-dimensionaldatasets.2
5.Регресия на билото
Whenthereismultiplecollinearity(independentvariablesarehighlycorrelated)betweenthedata,ridgeregressionanalysisisrequired.Inthepresenceofmulticollinearity,althoughtheestimatedvaluemeasuredbytheleastsquaremethod(OLS)doesnothaveabias,theirvariancewillbelarge,whichmakestheobservedvalueveryfarfromthetruevalue.Ridgeregressionreducesthestandarderrorbyaddingadeviationvaluetotheregressionestimate.
Inthelinearequation,thepredictionerrorcanbedividedinto2components,oneiscausedbybiasandtheotheriscausedbyvariance.Thepredictionerrormaybecausedbyeitherorbothofthese.Here,theerrorcausedbyvariancewillbediscussed.
Ridgeregressionsolvestheproblemofmulticollinearitythroughtheshrinkageparameterλ(lambda).Considerthefollowingequation:
L2=argmin||y=xβ||
+λ||β||
Inthisformula,Therearetwocomponents.Thefirstistheleastsquareterm,andtheotherisλtimesβ-square,whereβisthecorrelationcoefficientvector,whichisaddedtotheleastsquaretermtogetherwiththeshrinkageparametertogetaverylowvariance.
6. Ласорегресия
Itissimilartoridgeregression.Lasso(LeastAbsoluteShrinkageandSelectionOperator)willalsogiveapenaltyvaluetotheregressioncoefficientvector.Inaddition,itcanreducethedegreeofvariationandimprovetheaccuracyofthelinearregressionmodel.Takealookatthefollowingformula:
L1=agrmin||y-xβ||
+λ||β||
LassoregressionandRidgeregressionhaveOnedifferenceisthatthepenaltyfunctionitusesistheL1norm,nottheL2norm.Thisleadstoapenalty(orequaltothesumoftheabsolutevalueoftheconstraintestimate)valuethatmakessomeparameterestimatesequaltozero.Thelargerthepenaltyvalueis,thefurtherestimationwillmakethereductionvalueclosertozero.Thiswillresultintheselectionofvariablesfromthegivennvariables.
Ifthepredictedsetofvariablesishighlycorrelated,Lassowillselectoneofthevariablesandshrinktheotherstozero.
7.Еластична нерегресия
ElasticNetisamixtureofLassoandRidgeregressiontechniques.ItusesL1fortrainingandL2firstastheregularizationmatrix.ElasticNetisusefulwhentherearemultiplerelatedfeatures.Lassowillpickoneofthematrandom,whileElasticNetwillchoosetwo.
ThepracticaladvantagebetweenLassoandRidgeisthatitallowsElasticNettoinheritsomeofthestabilityofRidgeintheloopstate.
Dataexplorationisaninevitablepartofbuildingapredictivemodel.Itshouldbethefirststepwhenchoosingasuitablemodel,suchasidentifyingtherelationshipandinfluenceofvariables.Moresuitablefortheadvantagesofdifferentmodels,youcananalyzedifferentindexparameters,suchasstatisticallysignificantparameters,R-square,AdjustedR-square,AIC,BIC,anderrorterms.TheotheristheMallows’Cpcriterion.Thisismainlybycomparingthemodelwithallpossiblesub-models(orchoosingthemcarefully)andcheckingforpossibledeviationsinyourmodel.
Crossvalidationisthebestwaytoevaluatepredictivemodels.Here,divideyourdatasetintotwo(onefortrainingandoneforvalidation).Useasimplemeansquareerrorbetweentheobservedvalueandthepredictedvaluetomeasureyourpredictionaccuracy.
Ifyourdatasetismultiplemixedvariables,thenyoushouldnotchoosetheautomaticmodelselectionmethod,becauseyoushouldnotwanttoputallthevariablesinthesamemodelatthesametime.
Itwillalsodependonyourpurpose.Itmayhappenthatalesspowerfulmodeliseasiertoimplementthanahighlystatisticallysignificantmodel.Regressionregularizationmethods(Lasso,RidgeandElasticNet)workwellinthecaseofhigh-dimensionalandmulticollinearitybetweendatasetvariables.3
Предположения и съдържание
Indataanalysis,someconditionalassumptionsaregenerallyrequiredforthedata:
Хомогенност на дисперсията
LinearityRelations
Натрупване на ефекти
Грешка при измерване на променлива
Променливите следват многомерно нормално разпределение
Спазвайте независимостта
Themodeliscomplete(novariablesthatshouldnotbeentered,andnovariablesthatshouldbeenteredarenotincluded)
Грешката е независима и се подчинява на (0,1) нормално разпределение.
Realisticdataoftencannotfullycomplywiththeaboveassumptions.Therefore,statisticianshavedevelopedmanyregressionmodelstosolvetheconstraintsoftheassumedprocessoflinearregressionmodels.
Основното съдържание на регресионния анализ:
①Startingfromasetofdata,determinethequantitativerelationshipbetweencertainvariables,thatis,establishamathematicalmodelandestimatetheunknownparameters.Thecommonmethodofestimatingparametersistheleastsquaresmethod.
②Тествайте достоверността на тези отношения.
③Intherelationshipwheremanyindependentvariablesaffectadependentvariabletogether,determinewhich(orwhich)independentvariableshavesignificanteffects,andwhichindependentvariableshaveinsignificanteffects,willaffectsignificantTheindependentvariablesareaddedtothemodel,andtheinsignificantvariablesareeliminated,usuallybystepwiseregression,forwardregression,andbackwardregression.
④Usetherequiredrelationshiptopredictorcontrolacertainproductionprocess.Theapplicationofregressionanalysisisveryextensive,andthestatisticalsoftwarepackagemakesthecalculationofvariousregressionmethodsveryconvenient.
Inregressionanalysis,variablesaredividedintotwocategories.Onetypeisdependentvariables,whichareusuallyatypeofindexthatisconcernedinactualproblems,usuallyrepresentedbyY;andtheothertypeofvariablethataffectsthevalueofthedependentvariableiscalledindependentvariable,whichisrepresentedbyX.
Основните проблеми на изследването на регресионния анализ са:
(1)DeterminethequantitativerelationshipexpressionbetweenYandX,thisexpressioniscalledregressionequation;
(2) Тестване на надеждността на полученото регресионно уравнение;
(3) Определяне на ново дали независимата променлива X има ефект върху зависимата променлива Y;
(4) Използвайте полученото регресионно уравнение за прогнозиране и контрол.4
Приложение
Correlationanalysisstudiesthecorrelationbetweenphenomena,thedirectionandclosenessofcorrelation,andgenerallydoesnotdistinguishbetweenindependentvariablesordependentvariables.Regressionanalysisistoanalyzethespecificformsofcorrelationbetweenphenomena,determinethecausalrelationship,andusemathematicalmodelstoexpressthespecificrelationship.Forexample,itcanbeknownfromcorrelationanalysisthat"quality"and"usersatisfaction"variablesarecloselyrelated,butwhichvariablebetweenthesetwovariablesisaffectedbywhichvariable,andthedegreeofinfluence,requiresregressionanalysis.tomakesure.1
Generallyspeaking,regressionanalysisistodeterminethecausalrelationshipbetweendependentvariablesandindependentvariables,establisharegressionmodel,andsolvetheparametersofthemodelbasedonthemeasureddata,andthenevaluatetheregressionmodelWhetheritcanfitthemeasureddatawell;ifitcanfitwell,youcanmakefurtherpredictionsbasedontheindependentvariables.
Forexample,ifyouwanttostudythecausalrelationshipbetweenqualityandusersatisfaction,inapracticalsense,productqualitywillaffectusersatisfaction,sosetusersatisfactionasthedependentvariableandrecorditasY;Qualityistheindependentvariable,denotedasX.Thefollowinglinearrelationshipcanusuallybeestablished:Y=A+BX+§
where:AandBareundeterminedparameters,Aistheinterceptoftheregressionline;Bistheslopeoftheregressionline,whichmeansthatXchangesbyoneInunit,theaveragechangeofY;§isarandomerroritemthatdependsonusersatisfaction.
За емпиричното регресионно уравнение: y=0,857+0,836x
Theinterceptoftheregressionlineonthey-axisis0.857andtheslopeis0.836,whichmeansthatforeverypointinquality,usersatisfactionAnaverageincreaseof0.836points;inotherwords,thecontributionofa1pointimprovementinqualitytousersatisfactionis0.836points.
Theexampleshownaboveisasimplelinearregressionproblemofoneindependentvariable.Duringdataanalysis,thiscanalsobeextendedtomultipleregressionofmultipleindependentvariables.PleaserefertothespecificregressionprocessandmeaningRefertorelevantstatisticsbooks.Inaddition,intheSPSSresultoutput,R2,FtestvalueandTtestvaluecanalsobereported.R2isalsocalledthecoefficientofdeterminationoftheequation,whichindicatesthedegreeofinterpretationofthevariableXtoYintheequation.ThevalueofR2isbetween0and1.Thecloserto1,thestrongertheinterpretationabilityofXtoYintheequation.R2isusuallymultipliedby100%toexpressthepercentageofYchangeexplainedbytheregressionequation.TheFtestisoutputthroughtheanalysisofvariancetable,andthesignificancelevelisusedtotestwhetherthelinearrelationshipoftheregressionequationissignificant.Generallyspeaking,significancelevelsabove0.05aremeaningful.WhentheFtestpasses,itmeansthatatleastoneoftheregressioncoefficientsintheequationissignificant,butnotallregressioncoefficientsaresignificant,soaTtestisneededtoverifythesignificanceoftheregressioncoefficients.Similarly,theTtestcanbedeterminedbythesignificanceleveloralook-uptable.Intheexampleshownabove,themeaningofeachparameterisshowninthetablebelow.
Тест за уравнение на линейна регресия

индекс | стойност | Ниво на значимост | Значение |
R2 | 0,89 | „Качеството“ обяснява 89% от степента на промяна в „Удовлетворението на потребителите“ | |
F | 276,82 | 0,001 | Линейната връзка на регресионното уравнение е значима |
Т | 16,64 | 0,001 | Коефициентът на регресионното уравнение е значим |
Примерен линеен регресионен анализ на удовлетвореността на потребителите на SIM мобилни телефони и свързани променливи
TakethelinearregressionanalysisofSIMmobilephoneusersatisfactionandrelatedvariablesasanexampletofurtherillustrateApplicationoflinearregression.Inapracticalsense,mobilephoneusersatisfactionshouldberelatedtoproductquality,price,andimage.Therefore,“usersatisfaction”isusedasthedependentvariable,and“quality”,“image”and“price”areindependentvariables.regressionanalysis.UsingtheregressionanalysisofSPSSsoftware,theregressionequationisobtainedasfollows:
Удовлетвореност на потребителите=0,008×изображение+0,645×качество+0,221×цена
ForSIMmobilephones,thequalityisThecontributionofusersatisfactionisrelativelylarge.Forevery1pointincreaseinquality,usersatisfactionwillincreaseby0.645points;followedbyprice.Forevery1pointincreaseintheevaluationofpricesbyusers,theirsatisfactionwillincreaseby0.221points;andtheimageissatisfiedwiththeproductusers.Thecontributionofdegreeisrelativelysmall,andforevery1pointincreaseinimage,usersatisfactiononlyincreasesby0.008points.
Thetestindicatorsandtheirmeaningsoftheequationareasfollows:
Индекс | Ниво на значимост | значение | |
R2 | 0,89 | 89%удовлетворение на потребителите"степен на промяна | |
F | 248,53 | 0,001 | Линейната връзка на регресионното уравнение е значима |
T(изображение) | 0,00 | 1 000 | Променливата "изображение" почти не допринася за регресионното уравнение |
T (качество) | 13.93 | 0,001 | "Качеството" има голям принос към регресионното уравнение |
T(цена) | 5,00 | 0,001 | "Цената" има голям принос към регресионното уравнение | p>
От гледна точка на тестовите показатели на уравнението, „изображението“ няма голям принос към цялото регресионно уравнение и трябва да бъде изтрито. Така че „удовлетворението на потребителите“ и „удовлетворението на потребителите“ трябва да бъдат изтрити. Следват регресионните уравнения на областите „качество“ и „цена“: удовлетворение+качество=0,645 0,221×цена
Everytimeauser’sevaluationofthepriceincreasesby1point,hissatisfactionwillincreaseby0.221points(inthisexampleIn,“image”hasalmostnocontributiontotheequation,sotheequationobtainedissimilartothecoefficientsofthepreviousregressionequation).
Thetestindicatorsandmeaningsoftheequationareasfollows:
Индекс | Ниво на значимост | Значение | |
R2 | 0,89 | 89%Степен на промяна в "удовлетворението на потребителите" | |
F | 374,69 | 0,001 | Линейната връзка на регресионното уравнение е значима |
T (качество) | 15.15 | 0,001 | "Качеството" има голям принос към регресионното уравнение |
T(цена) | 5.06 | 0,001 | "Цената" има голям принос към регресионното уравнение |
Стъпка за определяне на променливи
Clarifythespecifictargetoftheprediction,andalsodeterminethedependentvariable.Ifthespecifictargetforforecastingisthesalesvolumeofthenextyear,thenthesalesvolumeYisthedependentvariable.Throughmarketresearchanddatareview,findtherelevantinfluencingfactorsoftheforecasttarget,thatis,independentvariables,andselectthemaininfluencingfactorsfromthem.
Установяване на прогнозен модел
Calculatebasedonhistoricalstatisticaldataofindependentvariablesanddependentvariables,andestablishregressionanalysisequations,thatis,regressionanalysispredictivemodels.
Извършване на корелационен анализ
Regressionanalysisisthemathematicalstatisticalanalysisandprocessingofcausalinfluencingfactors(independentvariables)andpredictionobjects(dependentvariables).Onlywhentheindependentvariableandthedependentvariabledohaveacertainrelationship,theestablishedregressionequationismeaningful.Therefore,whetherthefactorastheindependentvariableisrelatedtothepredictedobjectasthedependentvariable,thedegreeofcorrelation,andthedegreeofcertaintyinjudgingthedegreeofsuchcorrelation,havebecomeproblemsthatmustbesolvedinregressionanalysis.Forcorrelationanalysis,correlationisgenerallyrequired,andthedegreeofcorrelationbetweentheindependentvariableandthedependentvariableisjudgedbythesizeofthecorrelationcoefficient.
Изчислете грешката на прогнозата
Whethertheregressionpredictionmodelcanbeusedforactualpredictiondependsonthetestoftheregressionpredictionmodelandthecalculationofthepredictionerror.Onlywhentheregressionequationpassesvarioustestsandthepredictionerrorissmall,cantheregressionequationbeusedasapredictionmodelforprediction.
Определяне на прогнозираната стойност
Usingtheregressionpredictionmodeltocalculatethepredictedvalue,andcomprehensivelyanalyzethepredictedvaluetodeterminethefinalpredictedvalue.
Обърнете внимание на проблема
Whenapplyingtheregressionpredictionmethod,firstdeterminewhetherthereisacorrelationbetweenthevariables.Ifthereisnocorrelationbetweenthevariables,applyingregressionforecastingmethodstothesevariableswillgivewrongresults.
Payattentiontothecorrectapplicationofregressionanalysisandprediction:
①Usequalitativeanalysistodeterminethedependencebetweenphenomena;
②Avoidarbitraryextrapolationofregressionprediction;
③Applyappropriatedata;
